Feb 03, 2009
Decadal Occurrences Of Statewide Maximum Temperature Records
By Bruce Hall, Hall of Records
If an increased frequency of extreme temperature records are an indicator of a warming trend… as I have quoted that several times from those who advocate the theory of man-made global warming1 ... then take a look at the decadal frequency of those statewide monthly records in the animation below.
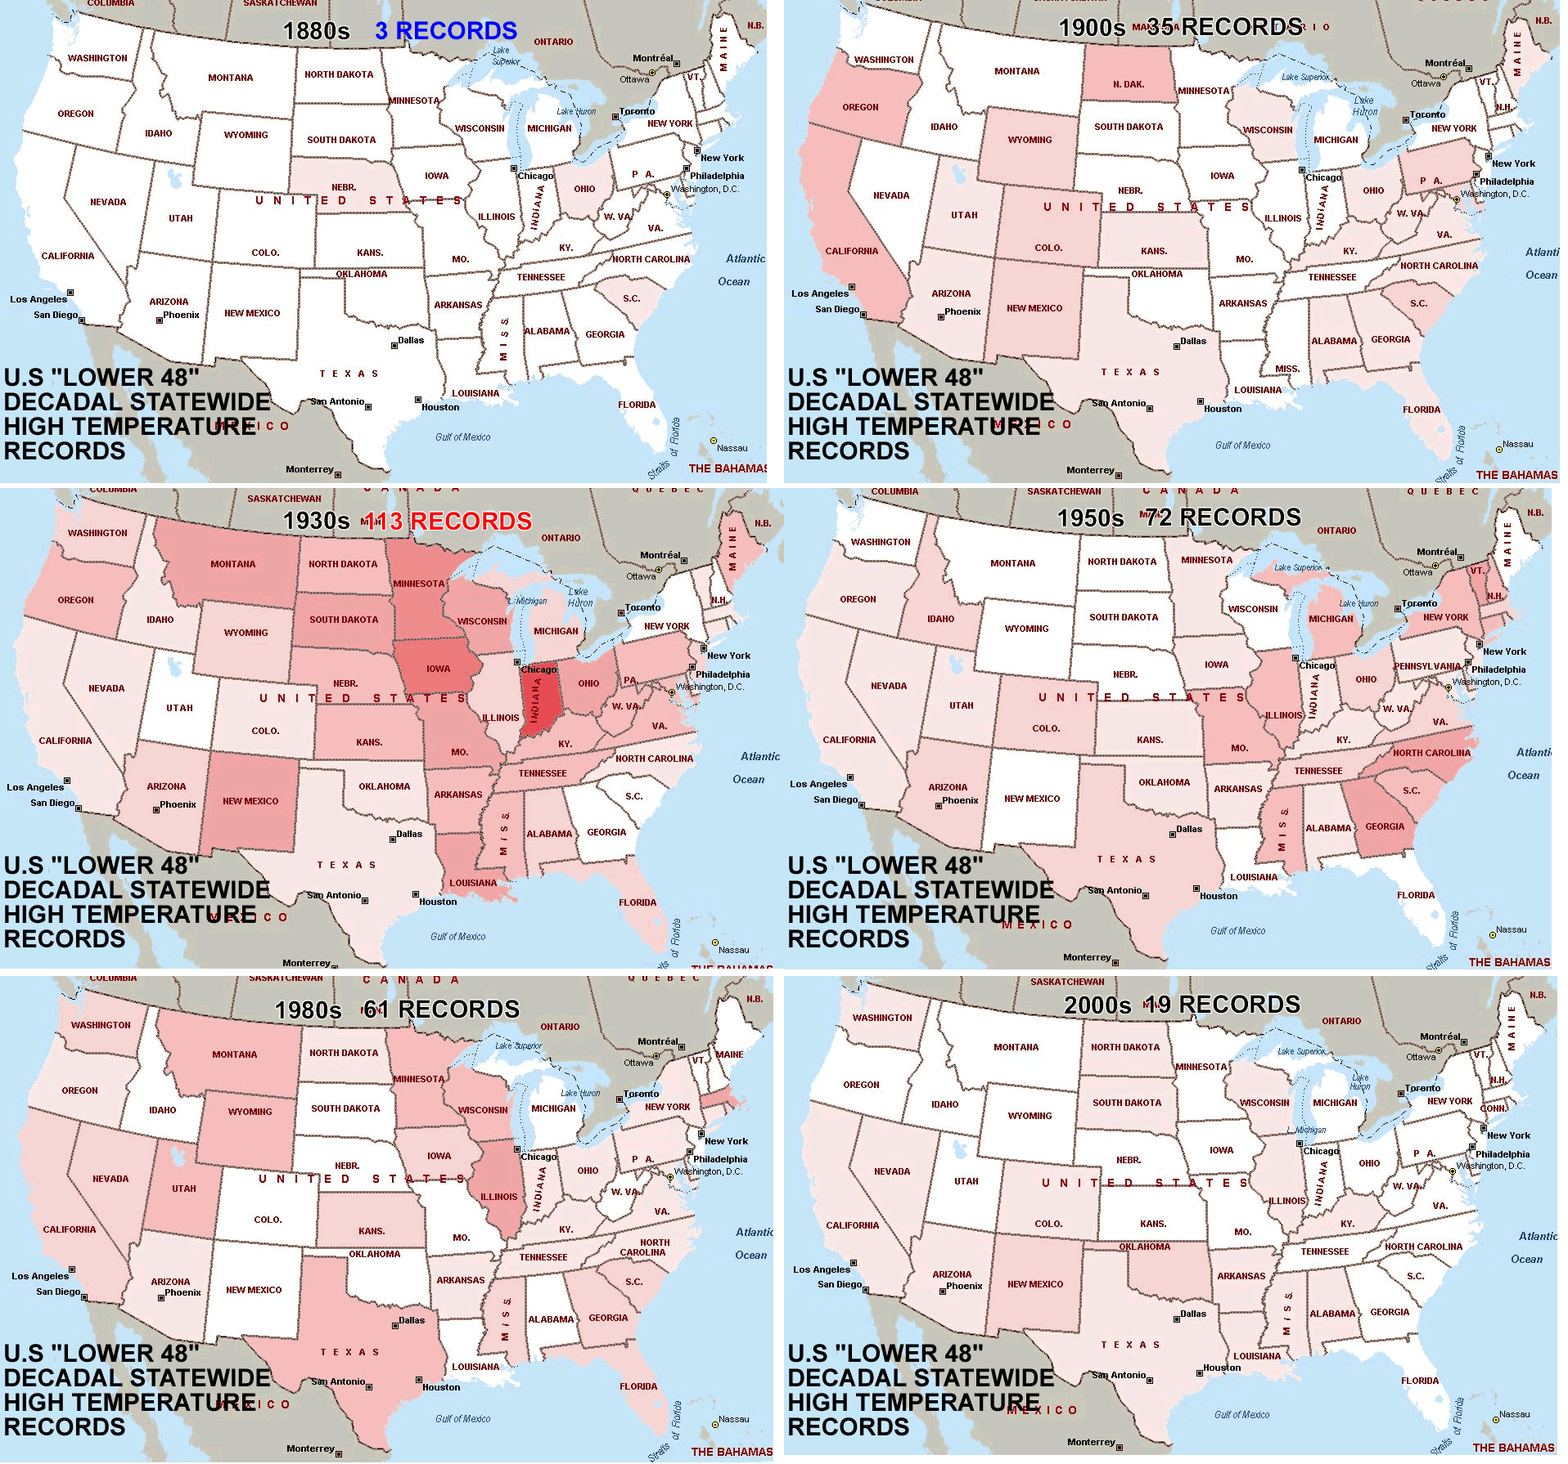
See full size animation here
As explained in previous posts, each state can have only 12 statewide, monthly records for the 13 decades tracked here… hence, they are “all-time” records for a state for a month.
Range goes from 0 [white] to 8 [dark red]. Indiana had the highest frequency of records in one decade with 8 still standing from the 1930s. See the table below for the actual count by decade. Old records are replaced if tied or surpassed by subsequent readings.
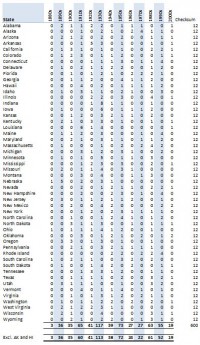
See larger image here.
The 1930s experienced the highest number of maximum extreme temperatures for which records have not been tied or surpassed subsequently. While the late 1990s did have a very brief hot period associated with El Nino, the 1990s were a rather ordinary period for extreme temperatures in the contiguous 48 states.
I have excluded Alaska and Hawaii from this animation because they are distinct and separate climate zones. For the record, however, Alaska’s decade of most frequent high temperature records was the 1970s with 4. Hawaii’s decade of most records was the 1910s. Those data are included in the table below.
The 1990s were only particularly hot, as reflected in these records, in New England and Idaho. These selective areas were far more restricted than the geographically widespread heat of the 1930s.
This animation goes to the heart of my arguments regarding global warming as it is reflected in U.S. temperature data.
The trendline used by those claiming a long term warming begins in a very cool climate period. Consequently, any trend from that point will be upward. The late 1990s were an aberration and not indicative of the general climate oscillations presented in these records. Frequency data is shown in the table below.
There is virtually no correlation between increased atmospheric CO2 and extreme high temperatures… at least for the continental United States which is where most of the man-made CO2 is supposed to have originated. I challenge those who claim global warming is real to:
Do a similar analysis for the 1880 - 2008 period for the rest of the world… insofar as any reliable data may exist.
Re-examine the notion that the 1880s is a reasonable starting point for establishing a meaningful trend because it appears to have been abnormally cool.
The data above are in direct conflict with those warming claims as it pertains to the U.S. over 13 decades.
Many others have questioned the failure of global warming computer models to fit past data, database “adjustments” to bias the temperature trend upward, and the impact of poorly sited weather stations as they relate to global warming claims, so it is not necessary to go over those issues here.

See larger image here.
______________
1 [An example] “These new peaks do not in themselves prove global warming, say scientists - but global warming makes them much more likely. “As you get a warming trend in temperatures, which is what we are observing, the risk of exceeding extreme temperatures increases dramatically,” said Peter Stott of the Met Office’s Hadley Centre for Climate Prediction and Research.” [quoted in The Independent; 19 July 2006]
here
Feb 03, 2009
Carbon Credits: Another Corrupt Currency? The Real Hockey-Stick Graph
By Joanne Nova on SPPI
Summary for PolicyMakers
Carbon credits are a form of fiat currency, yet as calls for carbon trading grow, ironically, another fiat currency collapses - destroying life savings, wiping out jobs, and taking down historic institutions overnight. Fiat money has a long history of failure, corruption and fraud. The inevitable booms, busts and inflation act as an invisible tax, transferring wealth from people who work and save to speculators, middle men, and crooks. The US dollar - sovereign issue of a great capitalist, democratic nation - is on life support. So far at least eight hundred billion dollars has been created from thin air to stop the banking system from crashing.
Meanwhile, global warming alarmists are asking us to create another fiat currency, this time based on hot air. Large multinational conglomerates are already pouring billions into exchanges and derivatives in anticipation of carbon trading. There are ‘options’ to buy credits in the future. There’s no longer any evidence that carbon matters much to our climate; and in the unlikely event that carbon might matter, the benefits of trading carbon don’t add up. If the US adopted Obama’s strict 80% reduction in emissions tomorrow, thus transforming the main energy source used by Americans since Columbus, the
savings in carbon merely delay the claimed warmer-Armageddon by six years.
Currencies based on nothing are powerful tools that have reshaped civilizations. But they draw out the darkest elements of human nature. We open this Pandora’s Box with trepidation. Is the risk worth the benefit?
As far as the currency goes, once or twice a century our monetary system breaks. To get an idea of the scale of the current crisis look at the Federal Reserve Bank graph of the monetary base. It’s a graph to take your breath away. This is the real hockey stick graph.
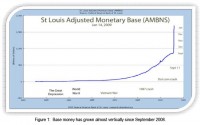
Larger image here.
Any new tax lets bankers, lawyers, politicians, con men and crooks slice more money from the people who are building, making, healing or teaching. The potential new renewable technologies sound great, but restoring vision to blind children only costs 27 pounds per child, so $100 million spent on a wind farm could have been used to rescue 151,000 blind children. Suddenly when a windfarm has a human cost, it doesn’t appear so attractive. Whatever we spend our money on is where we spend our brain power, our skill, our sweat - since it’s always at the expense of something else, we ought spend it wisely.
The US position as THE global hegemon is under a cloud, and parties are claiming that power is shifting as we speak.With the US economy based on a precipice, and no evidence left that atmospheric carbon matters, now is not the time to dump the energy source the nation was built on and tax everything that moves. Using a fiat currency system to control a harmless natural gas is like using a combine harvester to prune the roses. It might get the job done, but there’s a risk you’ll lose the house. Read this full excellent analysis here.
Jan 30, 2009
Mature Arctic Ivory Gull Seen in Massachusetts - First Time in Over a Century
By Anthony Watts, Watts Up With That
One of the claims about “global climate change” is that it will affect the normal ranges of flora and fauna of our planet. Well, with a very cold northern hemisphere this winter, that seems to happening. A bird not seen (as a mature adult) in Massachusetts since the 1800’s , an Ivory Gull, normally an inhabitant of arctic areas, has been spotted. Here are the details from the Plymouth, MA Patriot-Ledger. - Anthony
GULL-LOVER’S TRAVELS: Birdwatchers flock to Plymouth to spot rare specimen
PLYMOUTH — Jan 28th, 2009
The temperatures were in the single digits, but not low enough to keep the gawkers away. A celebrity was in town, behind the East Bay Grille, a visitor not seen in these parts in decades, if not longer. But these weren’t paparazzi, and this wasn’t a Hollywood star. Rather, they were avid birdwatchers - about 20 in all - braving the frigid air as they scanned the bay and the edges of the breakwater with binoculars and spotting scopes.
And they would be rewarded, catching a glimpse of a glimpse of a rare, fully mature ivory gull. A birdwatcher reported seeing one in Plymouth last week, and another was spotted at Eastern Point Lighthouse in Gloucester. From Sunday through Tuesday, the avian visitor was a regular in Plymouth, much to the delight of birdwatchers, who came from near and far in hopes of adding the extremely rare bird to their life list.

Ivory gulls normally stay well above Newfoundland, living on Arctic ice where they follow whales and polar bears to feed on the scraps and carcasses they leave behind after making a kill. Until this year, the last report of a fully mature ivory gull in Massachusetts was in the 1800s. Three immature birds were seen in the 1940s. In 1976, another immature bird had been spotted in Rockport.
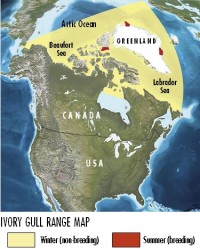
Russell Graham of Dallas is flying in Friday for a three-day visit. He’s hoping the gull will still be in town when he arrives. “The ivory gull is one of a handful of birds that every birder dreams of seeing but almost no one has” he said. “This isn’t a dream that’s confined to North America. There is also an immature bird in France that is causing the same reaction there. There are a couple of places where you can go in the summer and expect to see one but they are distant and expensive - Svalbard on Spitsbergen, Norway and Pond Inlet on Baffin Island, Canada. “I never thought I would have the chance to see one and I can’t pass up this once-in-a-lifetime opportunity.”
If the gull is gone, Graham will consider a side trip to Nova Scotia, where two adult ivory gulls have been seen recently. “I’ll be keeping my fingers crossed,” he said. John Fox of Arlington, Va., and his friend Adam D’Onofrio of Petersburg drove more than eight hours on Sunday to see the gull.
“No bird this morning,” Fox said a day later, shaking his head. “We left Virginia at three in the morning yesterday and arrived here 20 minutes too late.”
On Sunday morning, hundreds of people got to observe and photograph the gull as it fed on a chicken carcass someone put out on one of the docks in the parking lot. The bird stayed until 11 a.m., then flew across the harbor. It was not seen again for the rest of the day. Read more here.
Heavy snow has been common since 1992/93 in the northeast up to southeast Canada. Boston had more snow in the period from 1992/93 to 2004/05 than any other dozen years in history (since the 1880s). Last Boston had 52 inches last year, already 49 inches this year with a January nearly 5 degrees colder than normal. January 2004 was even more brutal in fact the third coldest month in Boston ever - see the Nantucket ferry and ice breaker stuck in ice in the photo below that year (courtesy TKelley).
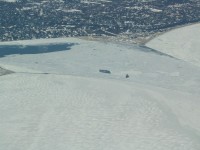
Larger here
Jan 28, 2009
The Amazing Story Behind the Global Warming Scam
By John Coleman, Coleman’s Corner
The key players are now all in place in Washington and in state governments across America to officially label carbon dioxide as a pollutant and enact laws that tax we citizens for our carbon footprints. Only two details stand in the way, the faltering economic times and a dramatic turn toward a colder climate. The last two bitter winters have lead to a rise in public awareness that CO2 is not a pollutant and is not a significant greenhouse gas that is triggering runaway global warming.
How did we ever get to this point where bad science is driving big government we have to struggle so to stop it? The story begins with an Oceanographer named Roger Revelle. He served with the Navy in World War II. After the war he became the Director of the Scripps Oceanographic Institute in La Jolla in San Diego, California. Revelle saw the opportunity to obtain major funding from the Navy for doing measurements and research on the ocean around the Pacific Atolls where the US military was conducting atomic bomb tests. He greatly expanded the Institute’s areas of interest and among others hired Hans Suess, a noted Chemist from the University of Chicago, who was very interested in the traces of carbon in the environment from the burning of fossil fuels. Revelle tagged on to Suess studies and co-authored a paper with him in 1957. The paper raises the possibility that the carbon dioxide might be creating a greenhouse effect and causing atmospheric warming. It seems to be a plea for funding for more studies. Funding, frankly, is where Revelle’s mind was most of the time.

Next Revelle hired a Geochemist named David Keeling to devise a way to measure the atmospheric content of Carbon dioxide. In 1960 Keeling published his first paper showing the increase in carbon dioxide in the atmosphere and linking the increase to the burning of fossil fuels. These two research papers became the bedrock of the science of global warming, even though they offered no proof that carbon dioxide was in fact a greenhouse gas. In addition they failed to explain how this trace gas, only a tiny fraction of the atmosphere, could have any significant impact on temperatures.
Now let me take you back to the 1950s when this was going on. Our cities were entrapped in a pall of pollution from the crude internal combustion engines that powered cars and trucks back then and from the uncontrolled emissions from power plants and factories. Cars and factories and power plants were filling the air with all sorts of pollutants. There was a valid and serious concern about the health consequences of this pollution and a strong environmental movement was developing to demand action. Government accepted this challenge and new environmental standards were set. Scientists and engineers came to the rescue. New reformulated fuels were developed for cars, as were new high tech, computer controlled engines and catalytic converters. By the mid seventies cars were no longer big time polluters, emitting only some carbon dioxide and water vapor from their tail pipes. Likewise, new fuel processing and smoke stack scrubbers were added to industrial and power plants and their emissions were greatly reduced, as well.
But an environmental movement had been established and its funding and very existence depended on having a continuing crisis issue. So the research papers from Scripps came at just the right moment. And, with them came the birth of an issue; man-made global warming from the carbon dioxide from the burning of fossil fuels. Read much more about what followed including Revelle having strong second thoughts on the CO2 science here.
John concludes: And, I am totally convinced there is no scientific basis for any of it. Global Warming. It is the hoax. It is bad science. It is a high jacking of public policy. It is no joke. It is the greatest scam in history.
Note: A reader noted that the story did not touch on Gore et al’s immoral attack on Singer and the recently deceased Revelle after the publication of the paper shown here.
Jan 28, 2009
Glacier Slowdown in Greenland: How Inconvenient
World Climate Report
In this week’s Science magazine, science writer Richard Kerr reports on some of the goings-on at this past December’s annual meeting of the American Geophysical Union. While he didn’t cover our presentation at the meeting in which we described our efforts at creating a reconstruction of ice melt across Greenland dating back into the late 1700s (we found that the greatest period of ice melt occurred in the decades around the 1930s), Kerr did cover some other recent findings concerning the workings of Greenland’s cryosphere in his article titled “Galloping Glaciers of Greenland Have Reined Themselves In.”
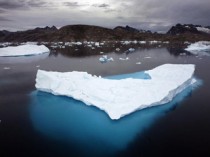
Here is how Kerr starts things off: “Things were looking bad around southeast Greenland a few years ago. There, the streams of ice flowing from the great ice sheet into the sea had begun speeding up in the late 1990s. Then, two of the biggest Greenland outlet glaciers really took off, and losses from the ice to the sea eventually doubled. Some climatologists speculated that global warming might have pushed Greenland past a tipping point into a scary new regime of wildly heightened ice loss and an ever-faster rise in sea level.
And some non-climatologists speculated disaster from rapidly rising seas as well. During his An Inconvenient Truth tour, Gore was fond of spinning the following tale:"[E]arlier this year [2006], yet another team of scientists reported that the previous twelve months saw 32 glacial earthquakes on Greenland between 4.6 and 5.1 on the Richter scale - a disturbing sign that a massive destabilization may now be underway deep within the second largest accumulation of ice on the planet, enough ice to raise sea level 20 feet worldwide if it broke up and slipped into the sea. Each passing day brings yet more evidence that we are now facing a planetary emergency - a climate crisis that demands immediate action to sharply reduce carbon dioxide emissions worldwide in order to turn down the earth’s thermostat and avert catastrophe.”
Oh how things have changed in the past 2 years. Gore’s “massive destabilization” mechanism for which the earthquakes were a supposed bellwether (meltwater lubrication of the flow channel) has been shown to be ineffective at producing long-term changes in glacier flow rate (e.g. (Joughin et al., 2008; van de Wal et al., 2008). And for still another, the recent speed-up of Greenland’s glaciers has even more recently slowed down.
Here is how Kerr describes the situation: “So much for Greenland ice’s Armageddon. “It has come to an end,” glaciologist Tavi Murray of Swansea University in the United Kingdom said during a session at the meeting. “There seems to have been a synchronous switch-off” of the speed-up, she said. Nearly everywhere around southeast Greenland, outlet glacier flows have returned to the levels of 2000.
All told, it is looking more like the IPCC’s estimates of a few inches of sea level rise from Greenland during the 21st century aren’t going to be that far off- despite loud protestations to the contrary from high profile alarm pullers.
Maybe Gore will go back and remove the 12 pages worth of picture and maps from his book showing what high profile places of the world will look like with a 20-foot sea level rise ("The site of the World Trade Center Memorial would be underwater"). But then again, probably not - after all the point is not to be truthful in the sense of reflecting a likely possibility, but to scare you into a particular course of action. Read full report here.
|


